
Spreadsheet Software
Excel & LibreOffice-Calc
It consists of rows and columns where users can
input numbers, text, or formulas.
Spreadsheets are commonly used for tasks such
as budgeting, financial analysis, data analysis, and creating charts or graphs.
Cell Address:
- A cell address in Excel refers to the unique identifier of a cell within a worksheet.
- It specifies the location of a cell based on its column and row position.
- Cell addresses are represented by a combination of letters and numbers. The letters represent the
column and the numbers represent the row. - For example, in the cell address "A1"
- In Excel 2007 and later versions (Excel 2007, Excel 2010, Excel 2013, Excel 2016, Excel 2019,
Excel for Microsoft 365): - There are 1,048,576 rows (numbered 1 to 1,048,576) and 16,384
columns (labeled A to XFD) in each worksheet. - Excel 2016 and later versions has 1,048,576 rows and 16,384 columns per worksheet.
- In recent versions of LibreOffice Calc (LibreOffice 5.0 and later):- There are 1,048,576 rows (numbered 1 to 1,048,576) and 1,024 columns (labeled A to AMJ) in each worksheet.
- Each worksheet can have up to 1,073,741,824 cells (1,024 columns multiplied by 1,048,576 rows).
- These limitations apply to the standard ODS file format used by LibreOffice Calc.
can be stored in a workbook may be limited by available memory and system resources.
Relative and Absolute Cell Referencing in Excel:
Relative Cell Referencing:
- Here Excel adjusts the cell references based on the relative position of the formula when it is copied to other cells.
- The formula entered in cell C2 is =A2*B2.
- The formula when copied to cell C3, Excel automatically adjusts the references to become =A3*B3.
- Similarly, the formula if copied to cell C4, it becomes =A4*B4.
- Excel adjusts the references relative to the formula's new position.
Absolute Cell Referencing:
- Absolute cell referencing means that the cell references do not change when the formula is copied to other cells.
- In cell C2, the entered formula is = A2*$B$2.
- The $ sign before the row number and column letter makes the reference absolute.
- When this formula is copied to cell C3, the reference to cell B2 remains unchanged, i.e., it stays as $B$2.
| A | B | C | D | |
| 1 | Number 1 | Number 2 | Relative Addressing | Absolute Addressing |
| 2 | 10 | 20 | =A2*B2 | =A2*$B$2 |
| 3 | 30 | 40 | =A3*B3 | =A3*$B$2 |
To summarize:
- Relative referencing adjusts the cell references based on the formula's position.
- Absolute referencing keeps the cell references constant, irrespective of the formula's position.
Budget Spreadsheet
| A | B | C | D | |
| 1 | Month | Income | Tax | Tax Rate |
| 2 | Jan | 50000 | =B2*$D$2 | 15% |
| 3 | Feb | 80000 | =B3*$D$2 | |
| 4 | Mar | 40000 | =B4*$D$2 |
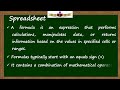
Functions in Excel:
- Functions
are pre-built formulas that perform specific calculations, manipulate data, or
automate tasks.
- Functions
are used to simplify complex calculations and make spreadsheet tasks more
efficient.
- Excel
offers a wide range of functions categorized into various groups, such as
mathematical, statistical, logical, text, date and time, financial, lookup and
reference, and more.
- The syntax of a function in Excel refers to the structure and order of its components, including the function name, arguments, and any optional parameters.
Syntax: =FunctionName(argument1, argument2, ...)
- =:
All Excel functions begin with an equal sign (=) to indicate that it's a
formula.
- FunctionName:
This is the name of the function you want to use. Examples include SUM,
AVERAGE, IF etc.
- (
):
Parentheses are used to enclose the function's arguments.
- Arguments:
These are the values, cell references, or ranges that the function operates on.
Functions may have zero or more arguments, depending on their requirements.
- Arguments are separated by commas (,).
- The colon (:) operator specifies the range of cells. Ex. A1:A10 means all cells from A1 to A10 cells.
Types of Functions:
Mathematical Functions:
- The basic mathematical operations like addition, subtraction,
multiplication, division, and exponentiation.
- Examples include SUM, AVERAGE, ROUND, ABS, and SQRT.
Logical Functions:
- A Logical
functions evaluates to TRUE or FALSE.
- Examples include IF, AND, OR, NOT, and IFERROR.
Text Functions:
Text functions manipulate text strings with the following operations:
- To extract specific characters
- To convert text to uppercase or lowercase
- To combine text strings
- To find a text within a string
- Examples include CONCATENATE, LEFT, RIGHT, MID, UPPER, LOWER, and FIND.
Date and Time Functions:
- The functions that handles date and
time values
- It includes calculations for adding or subtracting
days, months, or years
- To determine the current date and time
- To format dates and times
- To extract components like day, month, or year
- Examples include TODAY, NOW, DATE, TIME, YEAR, MONTH, DAY, and DATEDIF.
Charts and Graphs:
Data or Information is represented either in tabular form or in a graphical or pictorial form. A picture worth a thousand words.
- It is a graphical representation of data.
- It is designed to make information easy to
understand at a glance.
- It typically presents data in a visual format, such
as bars, lines, or pie slices.
- It allows viewers to quickly grasp trends, patterns,
and relationships within the data.
- It is commonly used in various fields, including business, science, finance, and education, to illustrate and communicate information effectively
Types of Charts and Graphs
- Application: Comparing values across categories,
showing trends over time.
- Example: Sales performance by month, comparison of product sales.
- Application: Comparing values across categories,
especially when categories have long names.
- Example: Market share of different companies, comparison of student performance by subject.
- Application: Showing trends over time, highlighting
changes in data over continuous intervals.
- Example: Stock price movements over a year, temperature variations throughout the day.
A real-world example of a line chart could be
visualizing the stock prices of a company over a certain period of time.
4. Pie Chart:
- Application: Showing the proportion of parts to a
whole, highlighting relative percentages.
- Example: Market share of different products, distribution of expenses in a budget.
A real-world example of a pie chart could be
visualizing the distribution of expenses in a household budget.
5. Scatter Plot:
- Application: Showing relationships between two sets
of data, identifying correlations.
- Example: Relationship between advertising spending and sales revenue, correlation between height and weight.
A real-world example of a scatter chart could be
visualizing the relationship between the height and weight of individuals in a
population.
The following video demonstrates the use of different types of charts and graph in Excel and Calc.
1. Calc is a
(a) graphic program
(b) word processor
(c) spreadsheet
(d) None of the above
Answer: c
2. Which one of the following is spreadsheet software?
(a) Visi Calc
(b) Lotus 1-2-3
(c) Multiplan
(d) All of these
Answer: d
3. The intersection of row and column forms a
(a) square
(b) cell
(c) oval
(d) worksheet
Answer: b
4. The default file extension of Calc Work book is
(a) .xlr
(b) .exe
(c) .exl
(d) .ods
Answer: d
5. New, Open, Save etc are the commands of ............ in LibreOffice Calc .
(a) File
(b) Review
(c) Insert
(d) View
Answer: a
6. In Calc, the contents of the active cell are displayed in the
(a) footer bar
(b) tool bar
(c) task bar
(d) formula bar
Answer: d
7. Calc documents are stored as files called
(a) workforce
(b) worksheets
(c) worktables
(d) workgroups
Answer: b
8. Workbook is a collection of
(a) page setup
(b) buttons
(c) diagrams
(d) worksheets
Answer: d
9. In order to move from one worksheet to another in LibreOffice Calc workbook, one should click
(a) Active Cell
(b) Scroll bar
(c) Sheet tab
(d) Tab button
Answer: c
10. ............ appears at the bottom of the Calc window.
(a) Status bar
(b) Name box
(c) Formula bar
(d) Title bar
Answer: a
11. ..........tab is used to insert Media picture, etc.
(a) File
(b) Edit
(d) View
Answer: c
12. A worksheet range refers to
(a) a command used for date modeling
(b) a range of values such as from 23 to 234
(c) a group of cells
(d) a group of worksheets
Answer: c
13. A cell range always has the ......... symbol between the cell references.
(a) ; (semicolon)
(b) .(Full stop)
(c) , (comma)
(d) : (colon)
Answer: d
14. A cell range starting from first row, first column to fourth row and fifth column can be represented as
(a) [A1 : E4]
(b) [A0 : E3]
(c) [E4 : A1]
(d) [E3 : A0]
Answer: a
15. Cell address A4 in a formula means it is a
(a) mixed cell reference
(b) absolute cell reference
(c) relative cell reference
(d) All of the above
Answer: c
16. Cell address $A4 in a formula means it is a
(a) mixed cell reference
(b) absolute cell reference
(c) relative cell reference
(d) All of the above
Answer: c
17. Absolute cell referencing occurs when
(a) formula is dragged but the cell references do not adjust
(b) spreadsheet is saved with ‘‘absolute’’ as file name
(c) formula is dragged and the cell reference adjusts automatically
(d) $ symbol is a automatically added with each cell value
Answer: a
18. Under which tab, the Print Preview option is available for printing?
(a) Formulae
(b) Data
(c) File
(d) View
Answer: c
19. Which of the following will you use as an option for saving a file?
(a) Save button on standard toolbar
(b) Save option from File menu
(c) Pressing Ctrl + S
(d) All of the above
Answer: d
20. Which of the following is not a valid data type in Calc?
(a) Number
(b) Text
(c) Character
(d) Date/ Time
Answer: c
21. LibreOffice Calc stores dates internally as ....... .
(a) Date
(b) Text
(c) Number
(d) Date and time
Answer: c
22. To select a single entire column, the easiest method is to
(a) double click any cell in the column
(b) drag from the top cell in the column to the last cell in the column
(c) click the column heading
(d) click the row heading
Answer: c
23. The AutoFill feature
(a) Extends a sequential series of data
(b) automatically adds range of cell values
(c) applies a border around selected cells
(d) None of the above
Answer: a
24. Sorting and filtering provides you to.........the worksheet data.
(a) Formatting
(b) Manipulate
(c) Increase
(d) Decrease
Answer: b
25. Which allows you display the specific data?
(a) Sorting
(b) Filtering
(c) Scenario
(d) Custom sorting
Answer: b
26. To combine the range of cells for various calculations ................ operators are used.
(a) Arithmetic
(b) Reference
(c) Comparison
(d) Text concatenation
Answer: b
27. In Calc this is a predefine formula that performs calculations using specific value in a particular order.
(a) Value
(b) Data series
(c) Function
(d) Field
Answer: c
28. If cell range A1 : A5 contain the numbers 20, 16, 5, 36 and 7 then = AVERAGE (A1 : A5, 50) will display.
(a) 22. 167
(b) 27. 167
(c) 10
(d) 40
Answer: a
29. If you type = 2 * (6 − 4) in cell A1, what value will be displayed?
(a) 2
(b) 4
(c) 6
(d) 8
Answer: b
30. =COUNT (4, 78, False, 18) will return ....
(a) 2
(b) 3
(c) 4
(d) 5
Answer: b
31. In Calc charts are created using which tab?
(a) Insert
(b) Format
(c) File
(d) Sheet
Answer: a
32. A chart is created on the basis of values in
(a) Mail merge
(b) database
(c) spreadsheet
(d) document
Answer: c
33. Which of the following charts is used for comparing the changes in data over a period of time?
(a) Bar chart
(b) Area chart
(c) Scatter chart
(d) Line chart
Answer: d
34. Which of the following chart selects only one range of the data series?
(a) Line chart
(b) Pie chart
(c) Scatter chart
(d) Bar chart
Answer: b
35. The another name for the XY chart is
(a) Column chart
(b) Net chart
(c) Bar chart
(d) Scatter chart
Answer: d
36. A chart placed in a worksheet is called
(a) formatting chart
(b) embedded chart
(c) aligning chart
(d) hanging chart
Answer: b
37. Which of the following software used to create Pie chart?
(a) Browser software
(b) Database software
(c) Desktop publishing software
(d) Spreadsheet software
Answer: d
38. You can place the chart legend in the chart at
(a) bottom
(b) corner
(c) top, right and left
(d) All of these
Answer: d
39. .......... is the set of values that you want to plot in the chart.
(a) Data series
(b) Data label
(c) Chart area
(d) Gridlines
Answer: a
40. Which of the following shortcut key brings the cursor to the last cell on the sheet that contains data?
(a) Ctrl+Home
(b) Ctrl+End
(c) Ctrl+Page down
Answer: b
41. You can select all cells in a worksheet by pressing …… shortcut key.
(a) Ctrl+Z
(b) Ctrl+A
(c) Ctrl+D
(d) Ctrl+F
Answer: b
 Reviewed by Syed Hafiz Choudhary
on
May 08, 2024
Rating:
Reviewed by Syed Hafiz Choudhary
on
May 08, 2024
Rating:


No comments: